Introduction
It is nowadays a common notion that vast amounts of capital are traded through the
Stock Markets all around the world. National economies are strongly linked and heavily
influenced of the performance of their Stock Markets. Moreover, recently the Markets
have become a more accessible investment tool, not only for strategic investors but for
common people as well. Consequently they are not only related to macroeconomic
parameters, but they influence everyday life in a more direct way. Therefore they
constitute a mechanism which has important and direct social impacts.
The characteristic that all Stock Markets have in common is the uncertainty, which is
related with their short and long-term future state. This feature is undesirable for the
investor but it is also unavoidable whenever the Stock Market is selected as the
investment tool. The best that one can do is to try to reduce this uncertainty. Stock
Market Prediction (or Forecasting) is one of the instruments in this process.
The Stock Market prediction task divides researchers and academics into two groups
those who believe that we can devise mechanisms to predict the market and those who
believe that the market is efficient and whenever new information comes up the market
absorbs it by correcting itself, thus there is no space for prediction (EMH). Furthermore
they believe that the Stock Market follows a Random Walk, which implies that the best
prediction you can have about tomorrow’s value is today’s value.
In literature a number of different methods have been applied in order to predict Stock
Market returns. These methods can be grouped in four major categories: i) Technical
Analysis Methods, ii) Fundamental Analysis Methods, iii) Traditional Time Series
Forecasting and iv) Machine Learning Methods. Technical analysts, known as chartists,
attempt to predict the market by tracing patterns that come from the study of charts
which describe historic data of the market. Fundamental analysts study the intrinsic
value of an stock and they invest on it if they estimate that its current value is lower that
its intrinsic value. In Traditional Time Series forecasting an attempt to create linear
prediction models to trace patterns in historic data takes place. These linear models are
divided in two categories: the univariate and the multivariate regression models,
depending on whether they use one of more variables to approximate the Stock Market time series. Finally a number of methods have been developed under the common label
Machine Learning these methods use a set of samples and try to trace patterns in it
(linear or non-linear) in order to approximate the underlying function that generated the
data.
Investment Theories:An investment theory suggests what parameters one should take into account before
placing his (or her) capital on the market. Traditionally the investment community
accepts two major theories: the Firm Foundation and the Castles in the Air.
Reference to these theories allows us to understand how the market is shaped, or in
other words how the investors think and react. It is this sequence of ‘thought and
reaction’ by the investors that defines the capital allocation and thus the level of the
market.
There is no doubt that the majority of the people related to stock markets is trying to
achieve profit. Profit comes by investing in stocks that have a good future (short or long
term future). Thus what they are trying to accomplish one way or the other is to predict
16
the future of the market. But what determines this future? The way that people invest
their money is the answer; and people invest money based on the information they hold.
Therefore we have the following schema:
The factors that are under discussion on this schema are: the content of the
‘Information’ component and the way that the ‘Investor’ reacts when having this info.
On the other hand, according to the Castles in the Air theory the investors are triggered
by information that is related to other investors’ behavior. So for this theory the only
concern that the investor should have is to buy today with the price of 20 and sell
tomorrow with the price of 30, no matter what the intrinsic value of the firm he (or she)
invests on is.
Prediction Methods:The prediction of the market is without doubt an interesting task. In the literature there
are a number of methods applied to accomplish this task. These methods use various
approaches, ranging from highly informal ways (e.g. the study of a chart with the
fluctuation of the market) to more formal ways (e.g. linear or non-linear regressions).
We have categorized these techniques as follows:
- Technical Analysis Methods
- Fundamental Analysis Methods
- Traditional Time Series Prediction Methods
- Machine Learning Methods
The criterion to this categorization is the type of tools and the type of data that each
method is using in order to predict the market. What is common to these techniques is
that they are used to predict and thus benefit from the market’s future behavior.
Technical Analysis
“Technical analysis is the method of predicting the appropriate time to buy or sell a
stock used by those believing in the castles-in-the-air view of stock pricing”. The idea behind technical analysis is that share prices move in trends dictated by the
constantly changing attributes of investors in response to different forces. Using
technical data such as price, volume, highest and lowest prices per trading period the
technical analyst uses charts to predict future stock movements. Price charts are used to
detect trends, these trends are assumed to be based on supply and demand issues which
often have cyclical or noticeable patterns.
From the study of these charts trading rules
are extracted and used in the market environment. The technical analysts are known and
as ‘chartists’. Most chartists believe that the market is only 10 percent logical and 90
percent psychological. The chartist’s belief is that a careful study of what the other
investors are doing will shed light on what the crowed is likely to do in the future.
This is a very popular approach used to predict the market, which has been heavily
criticized. The major point of criticism is that the extraction of trading rules from the
study of charts is highly subjective therefore different analysts might extract different
trading rules by studying the same charts. Although it is possible to use this
methodology to predict the market on daily basis we will not follow this approach on
this study due to its subjective character.
Fundamental Analysis
“Fundamental analysis is the technique of applying the tenets of the firm foundation
theory to the selection of individual stocks”. The analysts that use this method of
prediction use fundamental data in order to have a clear picture of the firm (industry or
market) they will choose to invest on. They are aiming to compute the ‘real’ value of
the asset that they will invest in and they determine this value by studying variables
such as the growth, the dividend payout, the interest rates, the risk of investment, the
sales level, the tax rates an so on. Their objective is to calculate the intrinsic value of an
asset (e.g. of a stock). Since they do so they apply a simple trading rule. If the intrinsic
21
value of the asset is higher than the value it holds in the market, invest in it. If not,
consider it a bad investment and avoid it. The fundamental analysts believe that the
market is defined 90 percent by logical and 10 percent by physiological factors.
This type of analysis is not possible to fit in the objectives of our study. The reason for
this is that the data it uses in order to determine the intrinsic value of an asset does not
change on daily basis. Therefore fundamental analysis is helpful for predicting the
market only in a long-term basis.
Traditional Time Series Prediction:The Traditional Time Series Prediction analyzes historic data and attempts to
approximate future values of a time series as a linear combination of these historic data.
In econometrics there are two basic types of time series forecasting: univariate (simple
regression) and multivariate (multivariate regression).
These types of regression models are the most common tools used in econometrics to
predict time series. The way they are applied in practice is that firstly a set of factors
that influence (or more specific is assumed that influence) the series under prediction is
formed. These factors are the explanatory variables xi of the prediction model.
Then a
mapping between their values xit and the values of the time series yt (y is the to-be
explained variable) is done, so that pairs {xit , yt} are formed. These pairs are used to
define the importance of each explanatory variable in the formulation of the to-be
explained variable. In other words the linear combination of xi that approximates in an
optimum way y is defined. Univariate models are based on one explanatory variable
(I=1) while multivariate models use more than one variable (I>1).
Regression models have been used to predict stock market time series. A good example
of the use of multivariate regression is the work of Pesaran and Timmermann (1994)
.
They attempted prediction of the excess returns time series of S&P 500 and the
Dow Jones on monthly, quarterly and annually basis. The data they used was from Jan
1954 until Dec 1990. Initially they used the subset from Jan 1954 until Dec 1959 to
adjust the coefficients of the explanatory variables of their models, and then applied the
models to predict the returns for the next year, quarter and month respectively.
Machine Learning Methods:Several methods for inductive learning have been developed under the common label
“Machine Learning“. All these methods use a set of samples to generate an
approximation of the underling function that generated the data. The aim is to draw
conclusions from these samples in such way that when unseen data are presented to a
model it is possible to infer the to-be explained variable from these data. The methods
we discuss here are: The Nearest Neighbor and the Neural Networks Techniques. Both
of these methods have been applied to market prediction; particularly for Neural
Networks there is a rich literature related to the forecast of the market on daily basis.
Prediction Using Neural Networks
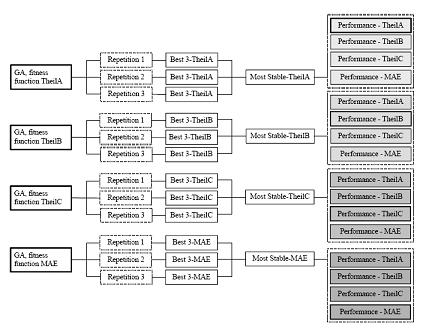
The experiment consisted of three phases (Figure A). In the first phase a genetic
algorithm (GA) searched the space of NNs with different structures and resulted a
generation with the fittest of all networks searched based on a metric which was either:
TheilA or TheilB or TheilC or MAE. The GA search was repeated three times for each
metric. Then the best three networks were selected from each repetition of the GA
search and for each one of the metrics.
The output of the first phase was a set of thirtysix
network structures.
In the second phase for each one of the thirty-six resulting network structures we
applied the following procedure. We trained (on Training1 set) and validated (on
Validation1 set) the network. Then we used the indicated number of epochs from the
validation procedure and based on it we retrained the network on the Training1 plus the
Validation1 set. Finally we tested the performance of the network on unseen data
(Validation2 set).
This procedure was repeated 50 times for each network structure for
random initializations of its weights. From the nine networks for each performance
statistic, we selected the most stable in terms of standard deviation of their performance.
Thus the output of the second phase was a set of four network structures.
During the third phase for each one of these four networks we applied the following
procedure 50 times. We trained each network on the first half of the Training Set and
we used the remaining half for validation. Then, using the indicated epochs by the
validation procedure, we retrained the network on the complete Training Set. Finally we
tested the network on the Test Set calculating all four metrics.
The performance for each
network on each metric was measured again in terms of standard deviation and mean of
its performance over 50 times that it was trained, validated and tested.